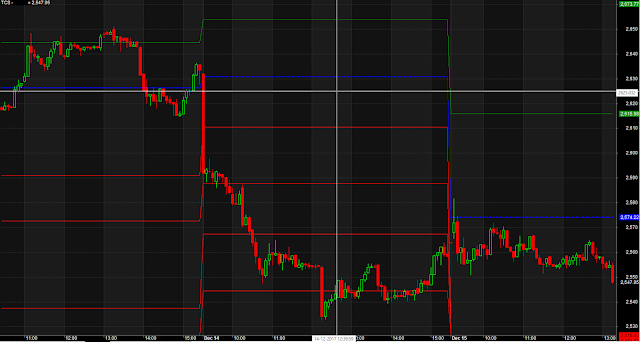
 |
| Automatic Pivot Intraday Specialist |
//www.aflcode.com

GraphXSpace = 5 ;
SetChartOptions(0,chartShowArrows|chartShowDates);

Plot(C,"Close",colorBlack, styleCandle);
ppl = ParamToggle("Plot Pivot Levels","Off|On",1);

numbars = LastValue(Cum(Status("barvisible")));
fraction= IIf(StrRight(Name(),3) == "", 3.2, 3.2);
hts = -33.5;

/* This code calculates the previous days high, low and close */
Hi1 = IIf(Day()!=Ref(Day(),-1),Ref(HighestSince(Day()!=Ref(Day(),-1),H,1),-1),0);
Hi = ValueWhen(Day()!=Ref(Day(),-1),Hi1,1);
Lo1 = IIf(Day()!=Ref(Day(),-1),Ref(LowestSince(Day()!=Ref(Day(),-1),L,1),-1),0);
Lo = ValueWhen(Day()!=Ref(Day(),-1),Lo1,1);
Cl1 = IIf(Day()!=Ref(Day(),-1),Ref(C,-1),0);
C1 = ValueWhen(Day()!=Ref(Day(),-1),Cl1,1);

//----------------------------------------------------------------------------------

/* This code calculates Daily Piovts */

rg = (Hi - Lo);
bp = (Hi + Lo + C1)/3; bpI = LastValue (bp,1);
r1 = (bp*2)-Lo; r1I = LastValue (r1,1);
s1 = (bp*2)-Hi; s1I = LastValue (s1,1);
r2 = bp + r1 - s1; r2I = LastValue (r2,1);
s2 = bp - r1 + s1; s2I = LastValue (s2,1);
r3 = bp + r2 - s1; r3I = LastValue (r3,1);
s3 = bp - r2 + s1; s3I = LastValue (s3,1);
r4 = bp + r2 - s2; r4I = LastValue (r4,1);
s4 = bp - r2 + s2; s4I = LastValue (s4,1);

if(ppl==1) {
Plot(bp,"",colorBlue,styleLine|styleDots|styleNoRescale);
Plot(s1,"",colorRed,styleLine|styleNoRescale);
Plot(s2,"",colorRed,styleLine|styleNoRescale);
Plot(s3,"",colorRed,styleLine|styleNoRescale);
Plot(s4,"",colorRed,styleLine|styleNoRescale);
Plot(r1,"",colorGreen,styleLine|styleNoRescale);
Plot(r2,"",colorGreen,styleLine|styleNoRescale);
Plot(r3,"",colorGreen,styleLine|styleNoRescale);
Plot(r4,"",colorGreen,styleLine|styleNoRescale);
PlotText(" Pivot = " + WriteVal(bp,fraction), LastValue(BarIndex())-(numbars/Hts), bpI +0.05, colorBlue);
PlotText(" r1 = " + WriteVal(r1,fraction), LastValue(BarIndex())-(numbars/Hts), r1I +0.05, colorGreen);
PlotText(" s1 = " + WriteVal(s1,fraction), LastValue(BarIndex())-(numbars/Hts), s1I +0.05, colorRed);
PlotText(" r2 = " + WriteVal(r2,fraction), LastValue(BarIndex())-(numbars/Hts), r2I +0.05, colorGreen);
PlotText(" s2 = " + WriteVal(s2,fraction), LastValue(BarIndex())-(numbars/Hts), s2I +0.05, colorRed);
PlotText(" r3 = " + WriteVal(r3,fraction), LastValue(BarIndex())-(numbars/Hts), r3I +0.05, colorGreen);
PlotText(" s3 = " + WriteVal(s3,fraction), LastValue(BarIndex())-(numbars/Hts), s3I +0.05, colorRed);
PlotText(" r4 = " + WriteVal(r4,fraction), LastValue(BarIndex())-(numbars/Hts), r4I +0.05, colorGreen);
PlotText(" s4 = " + WriteVal(s4,fraction), LastValue(BarIndex())-(numbars/Hts), s4I +0.05, colorRed);
}

//--end----------------------------------------------------------------------------
Sign up here with your email

ConversionConversion EmoticonEmoticon