 |
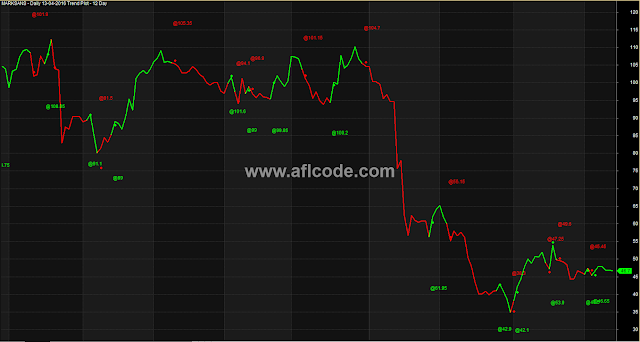
| 100 Percent Accurate Trend Plotter AFL |
//www.aflcode.com
_SECTION_BEGIN("B");
//ORIGINAL= ?
//MODIFIEWD=CASONI
function Rise( Pd, perd, Pl, perl )
{
 MAD = DEMA(Pd,perd);
 MAL = LinearReg(Pl,perl);
 CondR = ROC(MAD,1)>0 AND ROC(MAL,1)>0;
 CondF = ROC(MAD,1)<0 AND ROC(MAL,1)<0;
 R[0] = C[0]>(H[0]+L[0])/2;

 for(i=1;i<BarCount;i++)
 {
  if( CondR[i] )
  {
   R[i] = 1;
  }
  else
  {
   if( CondF[i] )
   {
    R[i] = 0;
   }
   else
   {
    R[i] = R[i-1];
   }
  }
 }
 return R;
}

PrD = C;
PrL = H/2+L/2;
PrdD = PrdL = PrdM = Param("Prd",12,2,40,1);

permax = Max(prdd,prdl);

Rs = IIf( BarIndex()<permax, 0, Rise(PrD, PrdD, PrL, PrdL) );
Fs = IIf( BarIndex()<permax, 0, 1-Rs );

Confirm = MA(C,prdm);

function DirBar( dr, df )
{
B[0] = 0;

for(i=1;i<BarCount;i++)
{
 if( dr[i-1] && df[i]  )
 {
  B[i] = 1;
 }
 else
 {
  if( df[i-1] && dr[i] )
  {
   B[i] = 1;
  }
  else
  {
   B[i] = B[i-1] + 1;
  }
 }
}
return B;
}

Bs = DirBar( Rs, Fs );
Direction = ROC(Confirm,1) > 0 AND ROC(Confirm,5) > 0;
Downward = ROC(Confirm,1) < 0 AND ROC(Confirm,5) < 0;
Buy = Rs AND Ref(Fs,-1);
Sell = Fs AND Ref(Rs,-1);

Change = IIf( Rs, H/ValueWhen(Fs,L)*100, L/ValueWhen(Rs,H)*100 );

Plot( C, "close", IIf( Rs, colorBrightGreen, IIf( Fs, colorRed, colorWhite )), styleLine|styleThick);

PlotShapes( shapeSmallCircle* Buy , colorBrightGreen, 0, H, -15 );
PlotShapes( shapeSmallCircle* Sell, colorRed, 0, L, 15 );


_N( Title = "{{NAME}} - {{INTERVAL}} {{DATE}} Trend Plot - "+prdd+" Day" );
GraphXSpace = 10;
dist = 2.0*ATR(10);
for( i = 0; i < BarCount; i++ )
{
if( Buy[i] ) PlotText( "\n@" + C[ i ], i, L[ i ]-dist[i], colorBrightGreen );
if( Sell[i] ) PlotText( "\n@" + C[ i ], i, H[ i ]+dist[i], colorRed);
}

Filter = Buy OR Sell;
AddColumn( Buy, "", 1 );
AddColumn( Sell, "", 1 );
_SECTION_END();
Sign up here with your email

ConversionConversion EmoticonEmoticon