 |
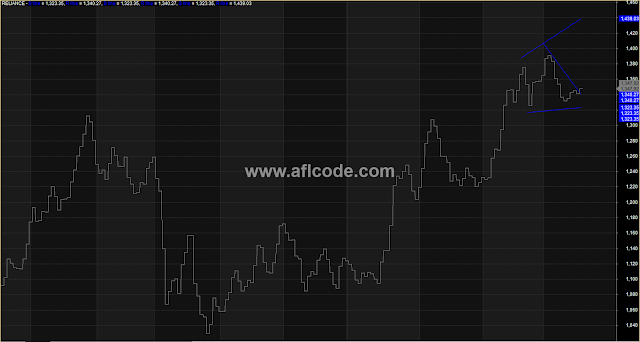
| Pivot Point With Support Resistance Trendline |
//www.aflcode.com


per1=Param("#1 S/R %", .25,.05,5,.05);
LB1=Param("#1 Lookback Period",2,2,30,1);
per2=Param("#2 S/R %", .5 ,.05,5,.05);
LB2=Param("#2 Lookback Period",2,2,30,1);
per3=Param("#3 S/R %", 2,.05,5,.05);
LB3=Param("#3 Lookback Period",2,2,30,1);
color=ParamColor("S/R Color",colorBlue);
colorPP=ParamColor("PP Color",colorGrey50);
////////////////////////////////////////////////////////////////////////
////Pivot and Support Resistance Lines     /////////////////////////////
////Plots a daily and hourly Pivot Point on 1min, 5min, etc... charts //
//////// Also, 3 adjustable S/R lines///////////////////////////////////
////////////////////////////////////////

/////////////////////////////PIVOT POINT////////////////////////////////
TimeFrameSet(inDaily);
AVGd = Ref((L + H + C),-1)/3;
"        PPd:\t "+ AVGd;
TimeFrameRestore();
Plot( TimeFrameExpand(AVGd,inDaily,expandFirst),"",colorPP,styleStaircase);

TimeFrameSet(inHourly);
AVGh = Ref((L + H + C),-1)/3;
"        PPh:\t "+ Avgh;
TimeFrameRestore();
Plot( TimeFrameExpand(AVGh,inHourly,expandFirst),"",colorPP,styleStaircase);

//////////////////////////S?R LINES 1/////////////////////////////////////
procedure SRlines(per,Lb)
{
ys0=LastValue(Trough(L,per,Lb));
ys1=LastValue(Trough(L,per,Lb-1));
xs0=BarCount - 1 - LastValue(TroughBars(L,per,Lb));
xs1=BarCount - 1 - LastValue(TroughBars(L,per,Lb-1));
yr0=LastValue(Peak(H,per,Lb));
yr1=LastValue(Peak(H,per,Lb-1));
xr0=BarCount - 1 - LastValue(PeakBars(H,per,Lb));
xr1=BarCount - 1 - LastValue(PeakBars(H,per,Lb-1));
sl = LineArray( xs0, ys0, xs1, ys1,1 );
rL = LineArray( xr0, yr0, xr1, yr1,1 );
Plot( sl, "S line", color,1 );
Plot( rl, "R line", color,1  );
}
//////////////////////////S?R LINES 2/////////////////////////////////////

SRlines(per1,Lb1);
SRlines(per2,Lb2);
SRlines(per3,Lb3);
Sign up here with your email

ConversionConversion EmoticonEmoticon