//www.aflcode.com
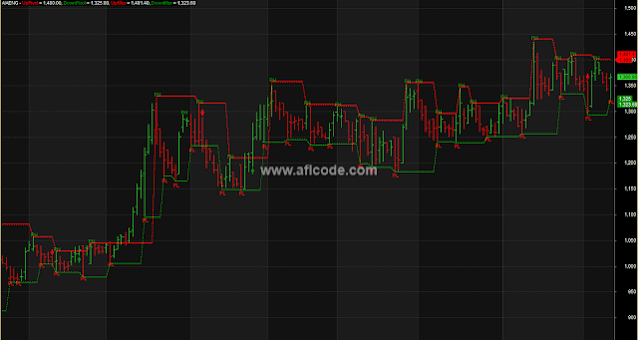
_SECTION_BEGIN("Pivot Trading System");

// User defined parameters.

GraphXSpace = 10; //defines how much extra space should be added above and below graph line (in percent).

dist = 0.25*ATR(10);
Capital=Param("Total capital",100000,10000,1000000,1000);
drawdown=Param("Max. loss per trade as % of Capital", 1.0,0.5,25.0,0.1);
room=Param("Room for S/L as % of Pivot value",0.001,0.001,0.02,0.001);

PH= ValueWhen(
(Ref(H,-2) > Ref(H, -4)) AND
(Ref(H,-2) > Ref(H, -3)) AND
(Ref(H,-2) > Ref(H, -1)) AND
(Ref(H,-2) > H), Ref(H,-2));

PL= ValueWhen(
(Ref(L,-2) <= Ref(L, -4)) AND
(Ref(L,-2) <= Ref(L, -3)) AND
(Ref(L,-2) <= Ref(L, -1)) AND
(Ref(L,-2) <= L), Ref(L,-2));


phfilter=PH+(room*PH);
plfilter=PL-(room*PL);

Plot(Ref(PH,2), "UpPivot", ParamColor("UpPivot Color",colorRed), styleDashed);
Plot(Ref(PL,2), "DownPivot",ParamColor("DownPivot Color",colorGreen), styleDashed);

Plot(Ref(Phfilter,2), "Upfilter", ParamColor("upfilter Color",colorRed), styleLine);
Plot(Ref(Plfilter,2), "Downfilter",ParamColor("dnfilter Color",colorGreen), styleLine);


for (a=4;a<BarCount;a++)
{
if ((H[a-2] >= H[a-4]) AND
(H[a-2] >= H[a-3]) AND
(H[a-2] >= H[a-1]) AND
(H[a-2] >= H[a]))
PlotText("PH", a-2, H[a-2], colorGreen);

if ((L[a-2] <= L[a-4]) AND
(L[a-2] <= L[a-3]) AND
(L[a-2] <= L[a-1]) AND
(L[a-2] <= L[a]))
PlotText("PL", a-2, L[a-2]-dist[a-2], colorRed);
}

//Condition for buy : Enter when Close crosses latest pivot high.
Buy = C> (PH+(room*PH));

initialStopBuy=Ref(PL,2)-(Ref(PL,2)*room/100);
trailStopBuy=IIf(C>PH,Ref(initialStopBuy,-1),initialStopBuy);

newStopBuy=trailStopBuy;

BuyLimitCapital=int(Capital/C);
SLbuy=round(C-initialStopBuy);
BuyLimitSL=int((Capital*drawdown)/(100*SLbuy));

//Condition for sell : Exit when previous pivot low is cracked.
Sell = C< (PL-(room*PL));

Buy = ExRem(Buy,Sell);
Sell= ExRem(Sell,Buy);

Short = Sell;
Cover = Buy;

Short=ExRem(Short,Cover);
Cover=ExRem(Cover,Short);

shape = Buy * shapeUpArrow + Sell * shapeDownArrow;
PlotShapes( shape, IIf( Buy, colorGreen, colorRed ),0, IIf( Buy, Low, High ) );


_SECTION_END();

_SECTION_BEGIN("Macd coloured price");
//============================================candle sticks=======================

a = Param("fast macd period",3,1,100,1);
b = Param("slow macd period",34,1,100,1);

Up_MACD_TRIX = MACD( a, b ) > Ref(MACD(a,b),-1);

Down_MACD_TRIX =  MACD( a, b ) < Ref(MACD(a,b),-1);

Colormacd = IIf(Up_MACD_TRIX,colorLime,IIf(Down_MACD_TRIX,colorRed,colorCustom12));


PlotOHLC( Open, High, Low, Close, "", Colormacd, styleBar );

_SECTION_END();
Sign up here with your email


ConversionConversion EmoticonEmoticon