 |
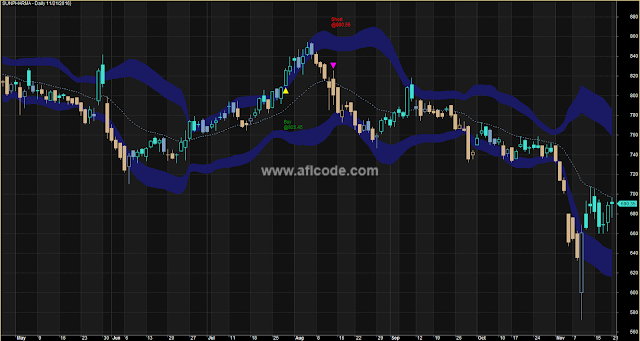
| Perfect Cloud Style Bollinger Band System |
//www.aflcode.com
_SECTION_BEGIN("Intraday System_Candle_Alerts BS on 200 ema");
/* Intraday template */

GraphXSpace = 3 ;

/* These are the calcs for the oscilator values and plots the paint
 bars*/
Osc = EMA(C,8) - EMA(C,34);
acc = Osc - EMA(Osc,13);
col = IIf(Osc > Ref(Osc,-1) AND acc > Ref(acc,-1),colorTurquoise,IIf(Osc < Ref(Osc,-1) AND acc < Ref(acc,-1),colorTan,colorLightBlue));
barcolor= 1;
Plot( Close, "Intraday Template" ,col/barcolor, styleCandle,styleThick|styleNoLabel);
// this sets the color of the body of the candlesticks to default

//---------------------------------------------------------------------------------

/* This is the code for the exponential moving average flipper */

mov = 200;
hi = EMA(H,mov);
lo = EMA(L,mov) ;
x1 = IIf(C>Ref(hi,-1),1,IIf(C<Ref(lo,-1),-1,0));
x2 = ValueWhen(x1!=0,x1,1);
st = IIf(x2==-1,Hi,Lo);
//Plot(st,"",colorYellow,styleNoLine|styleDots);
Buy=Cross(C,st);
Sell=Cross( Signal(), MACD() ) OR TimeNum()>151500;
Short=Cross(st,C);
Cover=Cross( MACD(), Signal() ) OR TimeNum()>151500;
shape = Buy * shapeUpTriangle + Short * shapeDownTriangle;
AlertIf( Short, "SOUND C:\\Windows\\Media\\ringout.wav", "Audio alert", 2 );
AlertIf( Buy, "SOUND C:\\Windows\\Media\\ringout.wav", "Audio alert", 2 );
PlotShapes( shape, IIf( Buy, colorYellow, colorCustom12 ),0, IIf( Buy, Low,
 High ) );

GraphXSpace = 5;
dist = 2.5*ATR(10);

for( i = 0; i < BarCount; i++ )
{
if( Buy[i] ) PlotText( "Buy\n@" + C[ i ], i, L[ i ]-dist[i], colorGreen
 );
if( Short[i] ) PlotText( "Short\n@" + C[ i ], i, H[ i ]+dist[i],
 colorRed);
}
_N(Title = StrFormat("{{NAME}} - {{INTERVAL}} {{DATE}} Open %g, Hi %g,
 Lo %g, Close %g (%.1f%%) {{VALUES}}", O, H, L, C,SelectedValue( ROC( C,
 1 ) ) ));


//---------------------------------------------------------------------------------

/* This next code calculates the previous days high, low and close */

Hi1 =
 IIf(Day()!=Ref(Day(),-1),Ref(HighestSince(Day()!=Ref(Day(),-1),H,1),-1),0);
Hi = ValueWhen(Day()!=Ref(Day(),-1),Hi1,1);
Lo1 =
 IIf(Day()!=Ref(Day(),-1),Ref(LowestSince(Day()!=Ref(Day(),-1),L,1),-1),0);
Lo = ValueWhen(Day()!=Ref(Day(),-1),Lo1,1);
Cl1 = IIf(Day()!=Ref(Day(),-1),Ref(C,-1),0);
Cl = ValueWhen(Day()!=Ref(Day(),-1),Cl1,1);

/*This code calculates the time left in the bar*/

//File: TimeLeft in Bar
//Sept 20, 2005
// Compute Time Left In Bar
//

BarTime1   = LastValue(TimeNum() - Now(4));
DataError  = IIf(Now(4) > TimeNum(),True,False);
TimeBase   = IIf(Interval(1)>0,1,0);


_N(StrBarTime = NumToStr(BarTime1,1.0,False));
BT_Length     = StrLen(StrBarTime);


_N(TimeLeft_    = WriteIf(BT_Length==1,"0:0"+StrBarTime,WriteIf(BT_Length==2,"0:"+StrBarTime,
                 WriteIf(BT_Length==3,StrLeft(StrBarTime,1)+":"+StrRight(StrBarTime,2),
                   StrLeft(StrBarTime,2)+":"+StrRight(StrBarTime,2)))));

TimeLeft   = WriteIf(TimeBase==1,TimeLeft_,"N/A");


//////////////////////////////////////////////////////////////////////////////
Filter=Buy OR Short;

AddColumn( IIf(Buy,1,IIf(Short,-1,Null)) ,"Buy/Short",1.0,colorWhite,IIf(Buy,colorDarkGreen,IIf(Short,colorRed,Null)),100);
AddColumn( IIf(Cover,2,IIf(Sell,-2,Null)) ,"Cover/Sell",1.0,colorWhite,IIf(Cover,colorLightBlue,IIf(Sell,colorCustom12,Null)),100);


_SECTION_BEGIN("Price");
SetChartOptions(0,chartShowArrows|chartShowDates);
_N(Title = StrFormat("{{NAME}} - {{INTERVAL}} {{DATE}}}", O, H, L, C, SelectedValue( ROC( C, 1 ) ) ));
Plot( C, "Close", ParamColor("Color", colorBlack ), styleNoTitle | styleHidden | ParamStyle("Style") | GetPriceStyle() );
_SECTION_END();

_SECTION_BEGIN("BB_double_(H+L)_20");


////BOL BAND 18////////////////////////////////////////////////////////


P = ParamField("Price field",-1);
Periods = Param("Periods", 15, 2, 100, 1 );
Width = Param("Width", 2, 0, 10, 0.05 );


M = (H+L)/2;

BT = BBandTop( M, 20, 1.5 );
BB = BBandBot( M, 20, 1.5 );

BColor = ColorRGB(5,125,150);
//Plot( BT, "BBTop" + _PARAM_VALUES(), BColor, styleDots|styleThick|styleNoLabel);
//Plot( BB, "BBBot" + _PARAM_VALUES(), BColor, styleDots|styleThick|styleNoLabel);

Plot(EMA(M,20),"",colorLightBlue,styleDashed|styleNoLabel);


BT1 = BBandTop( M, 20, 2.2 );
BB1 = BBandBot( M, 20, 2.2 );
//Plot( BT1, "BBTop1" + _PARAM_VALUES(), BColor, styleDots|styleNoLabel);
//Plot( BB1, "BBBot1" + _PARAM_VALUES(), BColor, styleDots|styleNoLabel);

PlotOHLC( 0, BT1 , BT , BT , "Cloud", IIf(BT1 > BT ,ColorRGB(25,25,100),colorDarkTeal), styleCloud | styleNoLabel);

PlotOHLC( 0, BB , BB1 , BB1 , "Cloud", IIf(BB > BB1 ,ColorRGB(25,25,100),colorDarkTeal), styleCloud | styleNoLabel);

_SECTION_END();
Sign up here with your email

ConversionConversion EmoticonEmoticon