 |
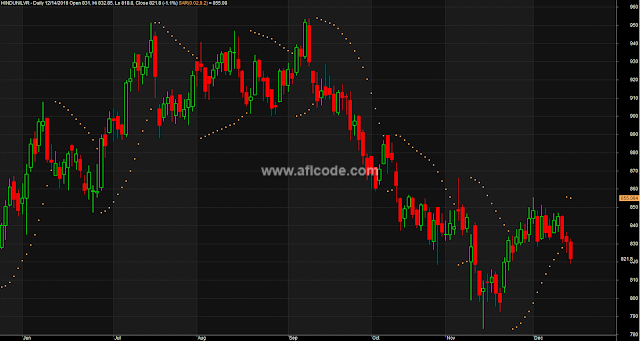
| Simple Parabolic SAR |
//www.aflcode.com
_SECTION_BEGIN("Price");
SetChartOptions(0,chartShowArrows|chartShowDates);
_N(Title = StrFormat("{{NAME}} - {{INTERVAL}} {{DATE}} Open %g, Hi %g, Lo %g, Close %g (%.1f%%) {{VALUES}}", O, H, L, C, SelectedValue( ROC( C, 1 ) ) ));
Plot( C, "Close", ParamColor("Color", colorBlack ), styleNoTitle | ParamStyle("Style") | GetPriceStyle() );
_SECTION_END();

_SECTION_BEGIN("SAR");
acc = Param("Acceleration", 0.02, 0, 1, 0.001 );
accm = Param("Max. acceleration", 0.2, 0, 1, 0.001 );
Plot( SAR( acc, accm ), _DEFAULT_NAME(), ParamColor( "Color", colorCycle ), ParamStyle("Style", styleDots | styleNoLine, maskDefault | styleDots | styleNoLine ) );

if( Status("action") == actionCommentary )
{
printf("The Parabolic SAR provides excellent exit points. You should Close long positions when the price falls below the SAR AND Close Short positions when the price rises above the SAR.");
}
_SECTION_END();
Sign up here with your email

ConversionConversion EmoticonEmoticon